Can a classic technical strategy outperform Buy & Hold in the Indian stock market?
Introduction: The Allure of the Golden Cross
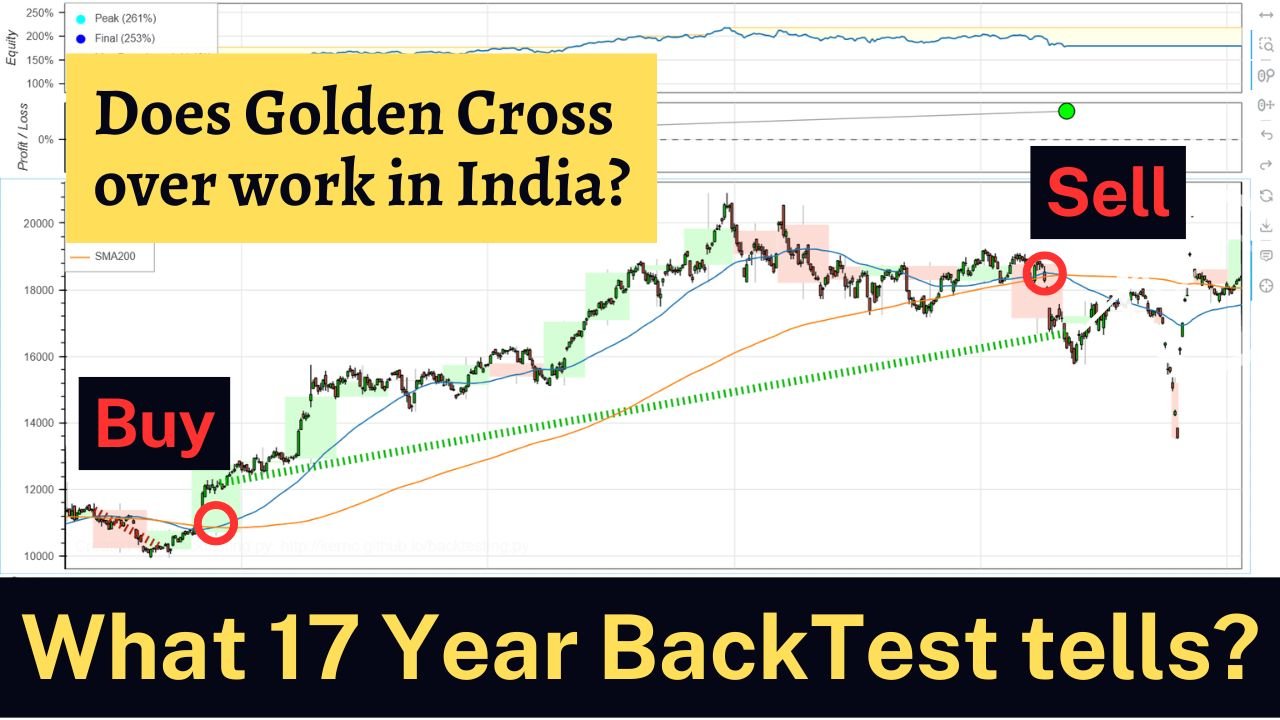
The Golden Cross—when the 50-day Simple Moving Average (SMA) crosses above the 200-day SMA—is one of the most well-known signals in technical trading. It promises trend-following profits while avoiding major drawdowns. But does it really work on Indian markets?
While most literature focuses on US indices like the S&P 500, we decided to test it on five major Indian indices:
- Nifty 50
- Sensex
- Bank Nifty
- Nifty IT
- Nifty FMCG
This study spans 17 years of historical data—from September 2007 to May 2025—covering multiple bull and bear cycles, including the Global Financial Crisis, the COVID crash, and India’s post-pandemic boom.
🧪 Methodology
We used proprietary software with clean daily data from Yahoo Finance. Here’s how the simulation was set up:
✅ Strategy Rules (50/200 SMA Crossover)
- Buy when 50-day SMA crosses above 200-day SMA.
- Exit when 50-day SMA crosses below 200-day SMA.
- No shorting.
- Full capital allocation on each trade.
- Risk-free rate: 7% used to calculate Sharpe Ratio.
🧾 Backtest Parameters
| Parameter | Value |
|---|---|
| Capital | ₹1,00,000 |
| Commission | 0.1% per trade side |
| Data range | 01-Sep-2007 to 30-May-2025 |
| Risk-free rate | 7% annual |
| Reinvestment | Yes |
| Data provider | Yahoo Finance |
📈 Comparative Results: Strategy vs Buy & Hold
Let’s dive into the performance across each index.
🔢 Key Metrics Compared
- CAGR (Compounded Annual Growth Rate)
- Sharpe Ratio (risk-adjusted return)
- Max Drawdown (Worst Peak-to-Trough fall)
- Win Rate % (% of time trade is profitable)
| Index | Strategy Return % | Buy&Hold Return % | Strategy CAGR % | Buy&Hold CAGR % | Sharpe | Win Rate % | Max Drawdown % |
|---|---|---|---|---|---|---|---|
| Nifty 50 | 137.68 | 452.51 | 5.01 | 10.14 | 0.4 | 63.64 | -41.54 |
| Sensex | 493.07 | 1931.24 | 7.57 | 13.13 | 0.51 | 69.23 | -36.72 |
| Bank Nifty | 152.74 | 705.35 | 5.38 | 12.51 | 0.35 | 80 | -41.12 |
| Nifty IT | 263.5 | 725.49 | 7.57 | 12.67 | 0.49 | 50 | -38.84 |
| Nifty FMCG | 54.47 | 547.19 | 3.08 | 13.92 | 0.31 | 62.5 | -30.89 |
📝 Observations:
- In every case, buy-and-hold outperformed the SMA crossover strategy on CAGR.
- Sharpe Ratios remained modest for the strategy, rarely exceeding 0.5.
- Drawdowns weren’t significantly reduced by using the SMA crossover; they still exceeded -40% for most indices.
📊 Visual Comparison: Interactive Charts
All trades and equity curves were saved as interactive HTML files. You can:
- Zoom in on trade periods
- Compare drawdowns vs market drops
- See when the strategy went to cash
Nifty 50
Bank Nifty
Sensex
Nifty IT
Nifty FMCG
🧠 Insights & Takeaways
1. 📉 Buy-and-Hold Wins in Indian Markets
Over 17 years, passive investing trounced the Golden Cross strategy across all indices. CAGR gaps ranged from 5–11%, which is significant over long horizons.
2. ⚠️ Risk-Reduction Was Modest
Despite the strategy’s intent to avoid bear markets, max drawdowns still exceeded -40% in several cases. That challenges the idea that the Golden Cross “protects capital.”
3. 🏦 Defensive Indices Hurt Performance
The Nifty FMCG index showed a low CAGR of 3.1% for the strategy. Why? Fewer, slower trends and low volatility meant the crossover gave fewer signals—and often too late.
4. 🔄 Too Many Whipsaws?
Because the 50-200 strategy is slow to react, it frequently entered late and exited early, especially in fast reversals like March 2020.
5. 📉 Sharpe Ratios Were Underwhelming
With a 7% risk-free rate, most Sharpe Ratios hovered around 0.3–0.5, indicating the strategy’s returns were only marginally better than risk-free instruments like FDs or G-Secs.
💡 How Can We Improve This Strategy?
| Adjustment | Potential Benefit |
|---|---|
| Use weekly bars | Reduces noise and false signals |
| Add volatility filter | Avoids sideways chop |
| Require index > 200 SMA | Filters out bear regimes |
| Use ATR-based position sizing | Manages risk more adaptively |
| Combine with fundamental trend | E.g., macro or FII flows |
🔚 Final Verdict: Should You Use Golden Cross?
If you’re trading Indian indices, the plain 50-200 SMA crossover strategy does not outperform buy-and-hold—at least not over a 17-year horizon.
- It underperforms in CAGR.
- It doesn’t meaningfully reduce drawdowns.
- It doesn’t generate high Sharpe ratios.
Unless paired with filters or volatility-based rules, the classic Golden Cross may be best suited as a supplementary indicator, not a standalone system.
Up Next
Tell me the next strategy and Stock that you want us to test.